1. 数据准备
首先,准备好地震数据,这里以SU教程里的一个示例数据为例。
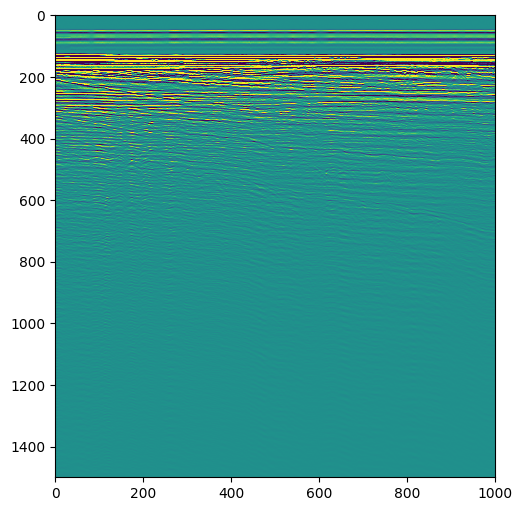
读取segy数据,看下长啥样,其中read_segy可以参考这篇笔记:Python读写segy数据。
1
2
3
| import numpy as np
import matplotlib.pyplot as plt
import read_segy
|
1
2
3
4
5
6
7
8
| data = read_segy.read_segy(data_dir='./test.segy',shotnum=1)
data = data[0]
print(data.shape)
print(data.min())
print(data.max())
plt.figure(figsize=(10,6))
plt.imshow(data,aspect=0.7,vmin=-100,vmax=100)
|
2. 定义plot_wiggle函数
1
2
3
4
5
6
7
8
9
10
11
12
13
14
15
16
17
18
19
20
21
22
23
24
25
26
27
28
29
30
31
32
33
34
35
| def plot_wiggle(ax, data, title, selected_traces, trace_spacing, scale=50):
"""
绘制地震波形图(Wiggle Plot)
参数:
ax: matplotlib的Axes对象
data: 地震数据(形状为 [时间采样点, 道数])
title: 图名
selected_traces: 选择要显示的道(如 range(0, 128, 3))每3道显示一道,避免波形太密
trace_spacing: 道间距(水平偏移量)
scale: 波形幅度缩放因子(默认50)
"""
num_samples, num_traces = data.shape
max_trace = max(selected_traces) if selected_traces else num_traces - 1
max_offset = (max_trace + 1) * trace_spacing # 动态计算最大偏移
for trace_idx in selected_traces:
trace = data[:, trace_idx]
trace_normalized = scale * trace / np.max(np.abs(trace)) if np.max(np.abs(trace)) != 0 else trace
offset = trace_idx * trace_spacing
if np.all(trace == 0):
ax.plot([offset, offset], [0, num_samples], color='black', linewidth=0.5)
else:
ax.plot(trace_normalized + offset, np.arange(num_samples), color='black', linewidth=0.5)
# 设置图形属性
ax.set_title(title)
ax.invert_yaxis()
ax.set_xlim(-trace_spacing, max_offset + trace_spacing) # 若横轴为距离
#ax.set_xlim(-trace_spacing, max_trace + trace_spacing)
ax.set_ylim(num_samples, 0)
ax.set_xlabel('Trace Number')
ax.set_ylabel('Time/ms')
ax.set_yticks(np.linspace(0, num_samples, num=6)) # 设置6个Y轴刻度
|
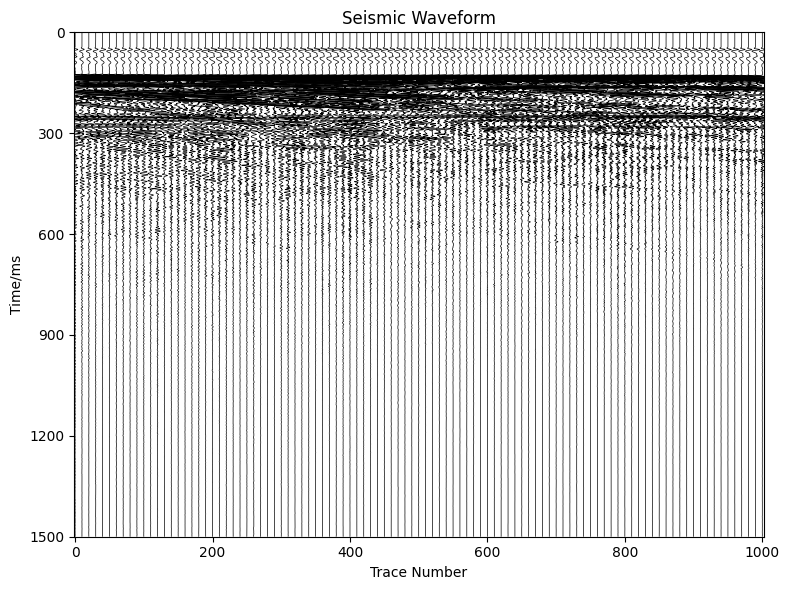
3. 绘制波形图示例
1
2
3
4
5
6
7
8
9
10
| # 使用示例
data = data
trace_spacing = 1 # 道间距
selected_traces = range(0, 1001, 10) # 每隔10道选1道绘制
fig, ax = plt.subplots(figsize=(8, 6))
plot_wiggle(ax, data, "Seismic Waveform", selected_traces, trace_spacing)
plt.tight_layout()
plt.show()
|
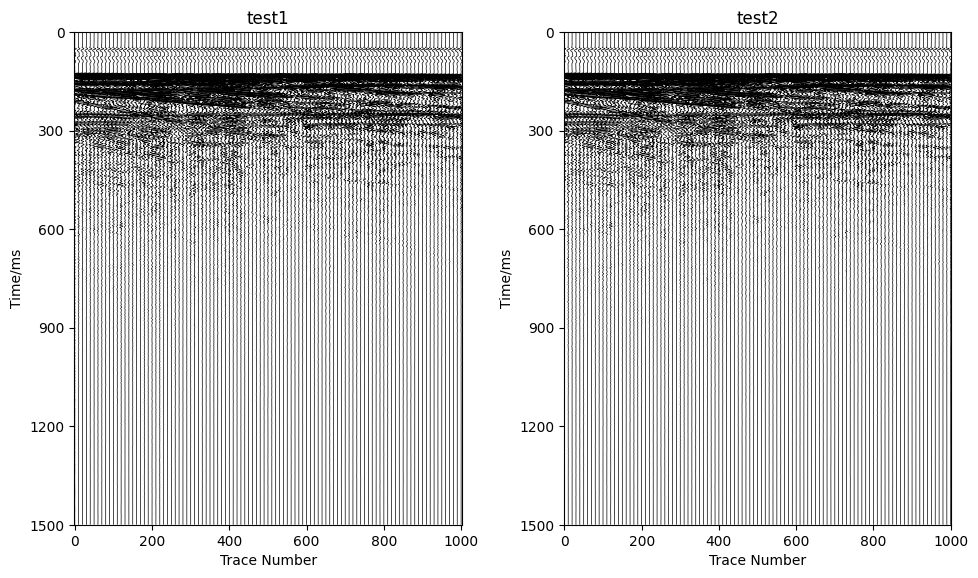
如果绘制多个子图,示例如下:
1
2
3
4
5
6
7
8
9
10
11
12
13
14
15
16
| trace_spacing = 1
selected_traces = range(0, 1001, 10)
data_list = [
data,
data
]
titles = [
'test1',
'test2'
]
fig, axs = plt.subplots(1, 2, figsize=(10, 6))
for i, (data, title) in enumerate(zip(data_list, titles)):
plot_wiggle(axs[i], data, title, selected_traces, trace_spacing)
plt.tight_layout(pad=1.5)
|