如果你读过Anaconda + VScode | Python环境安装与管理, 相信你已经配置好了python环境,本文介绍利用Python读写segy数据。
segyio是一个可以读写segy文件的python库。其详细说明可以参考官方文档或Github主页。
这里仅介绍一个segyio使用示例。
1. 准备数据
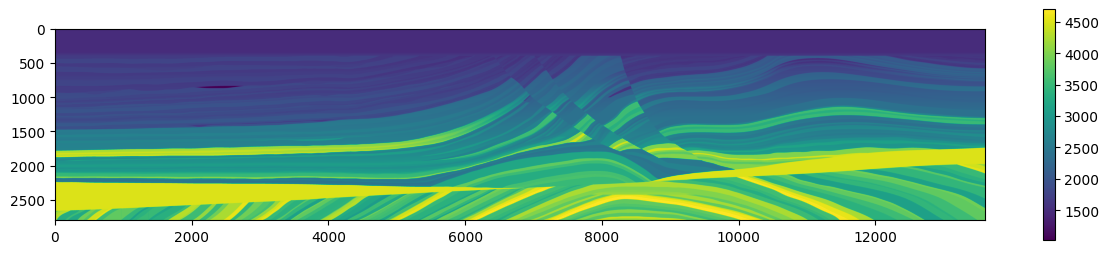
本文以Marmousi模型为例,读取segy文件。
首先,下载marmousi模型示例数据。
2. 安装segyio
首先, 打开Anaconda Prompt, 创建一个环境seismic (也可以在之前创建好的环境/base环境中直接安装) :
1 | conda create -n seismic python=3.11 |
激活该环境:
1 | conda activate seismic |
安装segyio:
1 | pip install segyio |
安装画图用的matplotlib库:
1 | pip install matplotlib #或conda install matplotlib |
3. 读取segy文件
打开vscode,创建.ipynb文件,选择已安装好segyio的环境seismic。
1 | import segyio |
1 | def read_segy(data_dir,shotnum=0): |
读入segy文件(前面下载好的marmousi模型)
1 | segyfile = '../elastic-marmousi-model/model/MODEL_P-WAVE_VELOCITY_1.25m.segy' |
画图:
1 | plt.figure(figsize=(15,3)) |
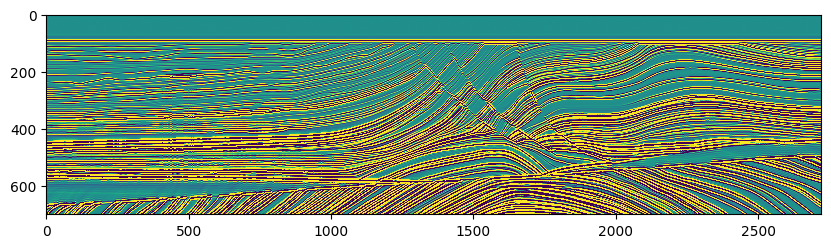
试一下另一个文件:
1 | segyfile1 = '../elastic-marmousi-model/processed_data/SEGY-Depth/SYNTHETIC.segy' |
4. 写入segy文件
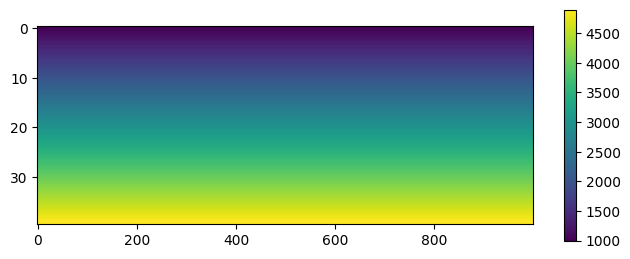
创建一个简单的一维数组(可以当成速度),并扩展到二维,画图:
1 | velo = np.arange(1000,5000,100) |
定义写入segy的函数:1
2
3
4
5
6
7
8
9
10
11
12
13
14
15
16
17
18def creat_velocity_segy(vel, dir, dx = 10, dt = 10):
seis = vel
spec = segyio.spec()
spec.samples = list(np.int32(np.arange(vel.shape[0])* dt))
spec.format = 5
spec.tracecount =vel.shape[1]
with segyio.create(dir, spec) as f:
## fill the file with data
for i in range(vel.shape[1]):
t = i
f.trace[t] = seis[:,i]
f.header[t][segyio.TraceField.FieldRecord] = 0
f.header[t][segyio.TraceField.ShotPoint] = 0
f.header[t][segyio.TraceField.TraceNumber] = i+1
f.header[t][segyio.TraceField.ReceiverGroupElevation] = 10
f.header[t][segyio.TraceField.GroupX] = i*dx
f.header[t][segyio.TraceField.SourceX] = i*dx
f.header[t][segyio.TraceField.TRACE_SAMPLE_INTERVAL] = 10
写入segy文件:
1 | savepath = './savepath/velomodel.segy' |
读取刚刚写的segy文件,画图检查是否正确:
1 | modelcheck = read_segy(savepath,shotnum=1) |
Tips 将炮集数据抽成共检波点道集
1 | paths= 'common_source.segy' |